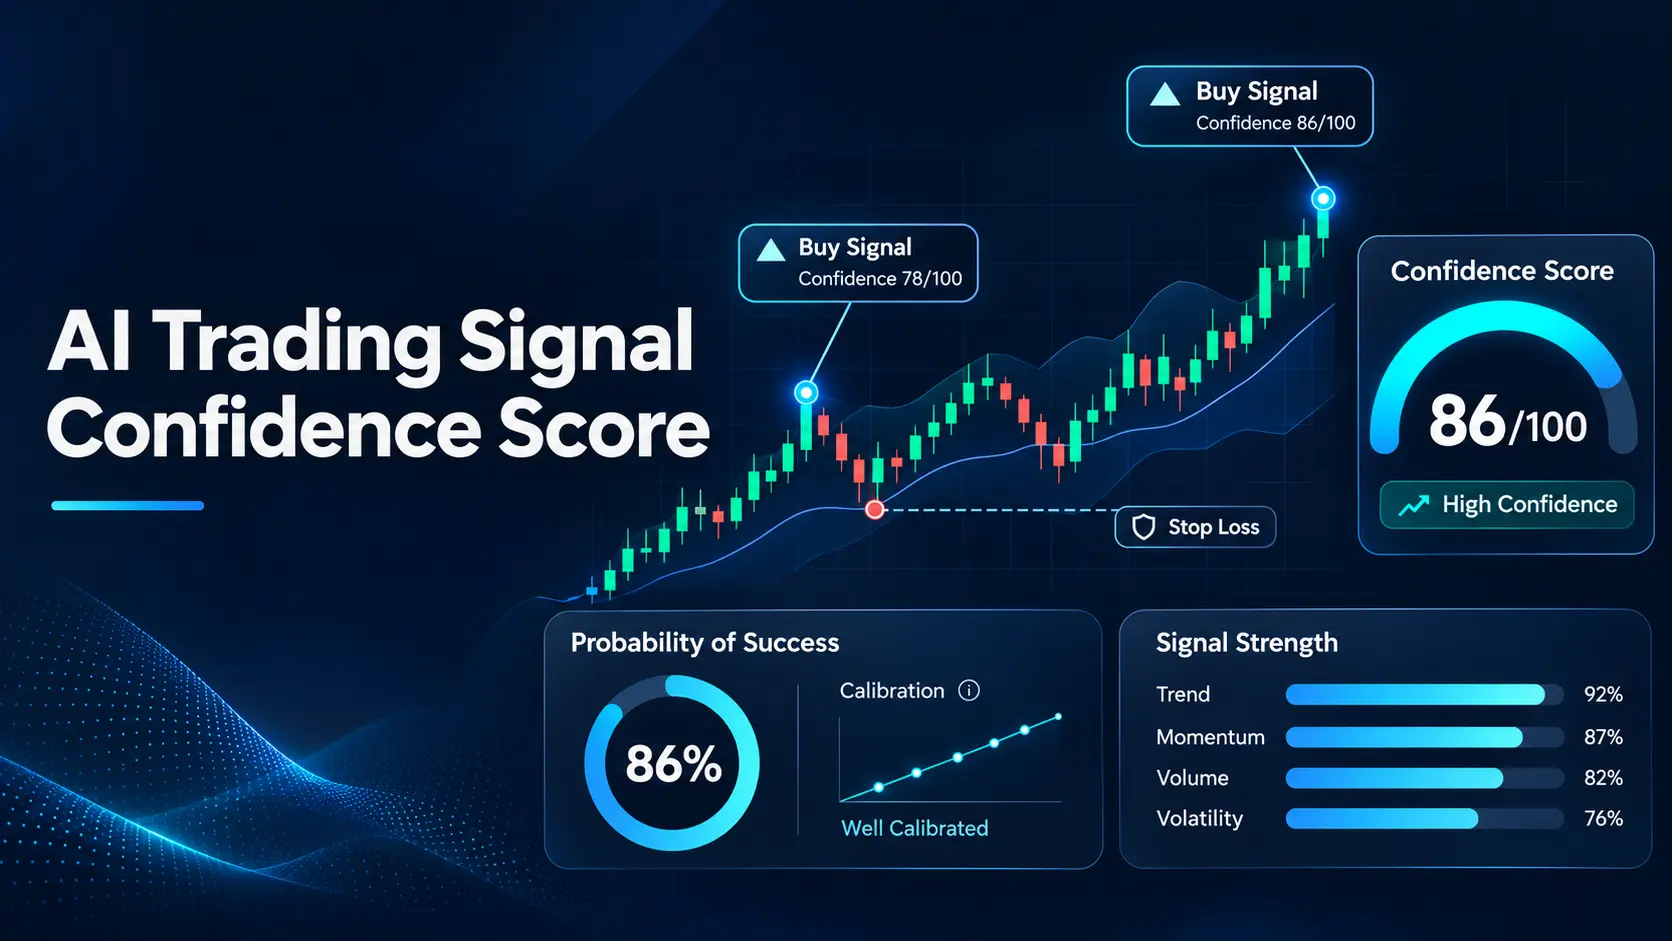
An AI Trading Signal Confidence Score shows how strongly a trading system supports a particular market setup. But an 85% confidence score does not automatically mean an 85% chance of making a profitable trade. The number could represent a model rating, a weighted combination of indicators, or a probability estimate. At Pineva, we believe the number only becomes useful when traders understand what it measures, how it was calculated, and whether its reliability has been tested.
Understanding AI Trading Confidence Scores
When a crypto trading platform displays a confidence score of 60, 80, or 90, the number represents the system’s assessment according to its own scoring method.
A higher score indicates stronger alignment with the conditions that the model was designed to evaluate. It does not establish that the market will move in the predicted direction.
For example, a trading platform might assign 90 out of 100 to a Bitcoin buying signal because its selected indicators, market structure, and volume conditions strongly support the setup.
Another platform could assign 70 to the same opportunity because it evaluates different information or applies different weights.
Neither number can be interpreted correctly without understanding the scoring method.
High and Low Confidence Scores
There is no universal confidence scale shared by every AI trading platform.
A score of 90 can represent strong agreement between technical indicators in one system. In another, 90% can represent a model’s estimated probability of a specific future event.
The same distinction applies to lower scores. A rating of 60 does not automatically identify an unsuitable trade, just as a rating of 95 does not establish a profitable opportunity.
We consider provider defined scoring criteria more useful than general rules claiming that every signal above a particular number deserves a trade.
The first step is to establish exactly what the displayed number measures.
How AI Trading Confidence Scores Are Calculated
An AI signal confidence score is produced from the information and analytical rules used by the provider.
Depending on the system, the calculation can involve technical indicators, market structure, trading volume, volatility, historical patterns, and machine learning predictions.
Not every trading confidence score uses machine learning. Some platforms calculate a rating using fixed indicator weights and present the result alongside AI generated analysis.
The distinction matters because the presence of a numerical score does not prove that an AI model has estimated the probability of success.
Weighted Confidence Scores
A weighted confidence score combines several analytical factors into one rating.
Consider a hypothetical crypto trading model that evaluates four conditions:
- Market structure alignment
- Trading volume confirmation
- Momentum strength
- Historical pattern similarity
Each factor contributes to the final rating according to its assigned weight.
Suppose the model gives 40 points to market structure, 30 to volume, 20 to momentum, and 10 to historical similarity.
If the current setup receives 35, 25, 18, and 8 points respectively, the final confidence score is 86 out of 100.
That result tells us the setup earned 86 points under this particular scoring method.
It does not establish an 86% probability of profit.
The weights and calculations in this example are illustrative, not measurements from Pineva or a live signal provider.
Model Probability Estimates
A machine learning model can produce a different type of output: an estimated probability for a clearly defined event.
For example, a model could estimate the probability that BTC/USDT will close above its current price at the end of the next hour.
For that number to be meaningful, the predicted event, observation period, and testing method must be specified.
Even a well calibrated probability of an upward price movement does not automatically represent the probability of a profitable trade.
Trading fees, price movement size, execution conditions, and exit rules still determine the financial outcome.
Confidence Score vs Probability and Win Rate
Three figures appear in trading analytics: confidence score, predicted probability, and historical win rate.
They describe different information and should not be treated as interchangeable.
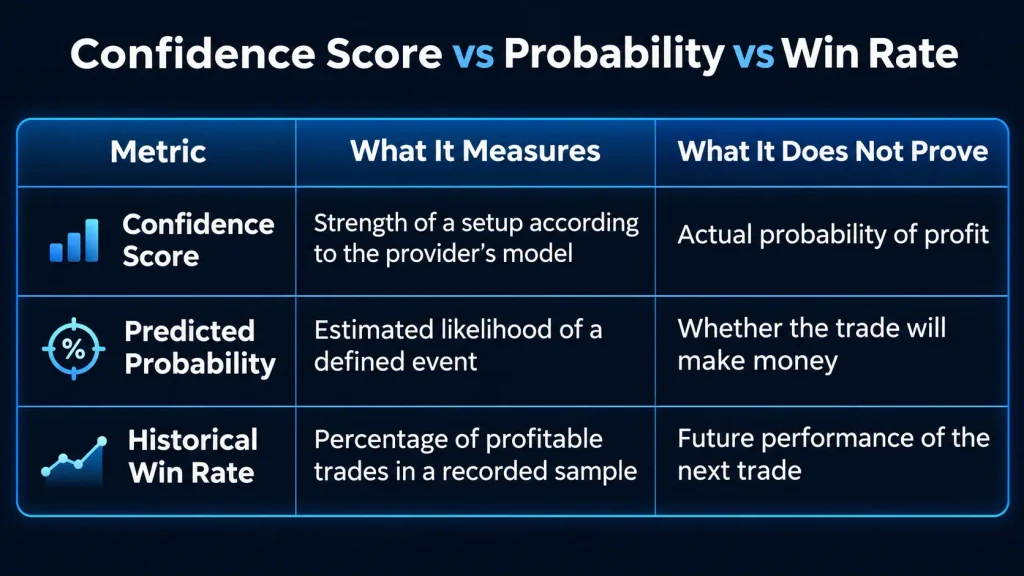
A trading signal confidence score can change as new information reaches the model. Historical win rate, by contrast, summarizes outcomes from a specified set of completed trades.
The difference becomes important when evaluating a platform that advertises a 90% confidence rating alongside a 65% historical win rate.
Those figures are not necessarily contradictory. One describes a current model output, while the other describes past trade results.
Before comparing them, we need to know the conditions used to generate the score and the rules used to classify historical trades as profitable.
Interpreting Confidence Scores in Crypto Trading
Consider a hypothetical BTC/USDT buying signal with the following information:
Trading pair: BTC/USDT
Direction: Long
Confidence score: 86/100
Entry condition: Price holds above a defined resistance level
Invalidation: Price breaks below the structural support level
Timeframe: One hour
The system has assigned an 86 out of 100 rating to this setup.
That number provides information about the model’s assessment, but it does not tell us whether the resistance level will hold or whether the resulting trade will be profitable.
We would first examine how the model defines its confidence rating and whether the required entry conditions remain valid.
Confidence and Market Conditions
The score must be interpreted within the market conditions that produced it.
A bullish trading setup evaluated during a clear upward trend is different from a similar setup appearing during a volatile trading range.
If the model accounts for those conditions, they can affect its rating. If it does not, the score cannot be assumed to reflect them.
A signal generated before a major price movement also requires reassessment after that movement.
The relevant question is whether the original conditions are still present, not whether the displayed score looks impressive.
Confidence and Trading Risk
The 86/100 rating does not determine an appropriate position size.
Position risk depends on the account’s available capital, the distance to the planned exit, and the amount the trader is prepared to lose.
A high confidence rating cannot replace an invalidation level.
At Pineva, we approach market analysis through research, conditional scenarios, and clearly defined risk boundaries. The score provides another piece of information to examine, not a reason to ignore those boundaries.
Confidence Score Reliability and Calibration
A useful confidence score needs evidence showing how its predictions or ratings relate to observed market outcomes.
For probability based models, one important concept is calibration.
Probability Calibration
A model is well calibrated when its predicted probabilities correspond closely to the observed frequency of the events it predicts.
For example, consider a model that repeatedly assigns an 80% probability to a specific market event.
Across a sufficiently large and representative collection of comparable predictions, a well calibrated model should see that event occur approximately 80% of the time.
This is not a guarantee for any individual prediction.
It is also essential to distinguish the event being predicted from the financial result of executing a trade.
A model can accurately estimate directional probabilities while the trading strategy using those estimates remains unprofitable.
Historical Evaluation
Confidence scores must also be examined using data that was not used to train the model.
Financial market data is time ordered. Testing should respect that order so the model cannot benefit from information that was unavailable when the original signal would have been generated.
When examining a provider’s confidence ratings, we look for a documented evaluation period, sample size, original signal records, and results from data outside the training period.
A collection of selected successful predictions is not sufficient evidence.
The provider should also distinguish model evaluation from actual trading performance. A prediction can be correct without producing a profitable executable trade.
Comparing AI Signal Confidence Scores Across Platforms
Two platforms displaying confidence ratings on a scale of 0 to 100 are not necessarily measuring the same thing.
One provider can use technical indicator agreement, while another produces probabilities from a trained machine learning model.
Even when both use probability estimates, they can predict different events or use different observation periods.
A rating of 92 from one service therefore cannot automatically be considered stronger than a rating of 78 from another.
Before comparing providers, we examine four details: the definition of the score, the event or setup being evaluated, the available historical evidence, and the method used to measure reliability.
This is particularly relevant when evaluating crypto signal services with their own confidence labels or proprietary rating systems.
Without consistent definitions and comparable testing, a numerical comparison gives a false impression of precision.
Using Confidence Scores in Trading Decisions
The purpose of a trading confidence score is to help evaluate information, not to replace the decision making process.
When reviewing AI Signals, we treat the confidence rating as one part of the broader market assessment.
A useful approach begins by understanding the model’s score, confirming the market conditions, and examining the proposed setup.
Signal Evaluation
Before acting on a scored signal, the following information should be clear:
- What the confidence score measures.
- Which market data and conditions support the rating.
- Whether the signal remains valid at the current price.
- What evidence supports the model’s reliability.
- Where the trading idea becomes invalid and how much capital is at risk.
These checks separate a numerical rating from an executable trading plan.
A strong score accompanied by unclear entry conditions or an undefined loss boundary is not enough to justify a position.
Position Sizing and Confidence
Confidence ratings should not be converted directly into larger position sizes without evidence that the scores are reliable and relevant to the strategy’s expected outcomes.
Increasing exposure simply because a model displays 95 instead of 75 introduces additional risk without establishing a corresponding improvement in expected returns.
The financial decision must still account for potential losses, the planned exit, and total portfolio exposure.
At Pineva, we believe a useful trading decision is one whose reasoning can be examined and whose risk is understood before execution.
A confidence score can contribute to that process, but it cannot replace it.
Final Thoughts
An AI Trading Signal Confidence Score can help traders understand how strongly a system supports a market setup, but its usefulness depends on what the number actually represents.
A score of 90 is not automatically more reliable than a score of 70, and neither should be interpreted as a guaranteed probability of profit.
The definition of the score, its calculation method, and the evidence supporting its reliability matter more than the number itself.
At Pineva, we believe market analysis should provide clarity rather than artificial certainty. Confidence ratings can contribute to that clarity when their limitations are understood and the underlying trading idea remains open to examination.
The objective is not to find the highest score. It is to understand whether the information behind that score is reliable enough to support a disciplined decision.
FAQ
My signal dropped from 88 to 65 after I entered. Should I close the trade?
A decrease in confidence does not automatically require closing a position. The trader should determine why the rating changed and whether the original trading conditions remain valid. Exit decisions should follow the established trading plan and its risk limits rather than an unexplained change in a model rating.
Can I combine confidence scores from two AI tools into one number?
Scores from different platforms should not be averaged unless they measure compatible outcomes and use comparable scales. Combining proprietary ratings without understanding their definitions can produce a number with no meaningful statistical interpretation. A combined model requires its own validation.
Does the same confidence score mean the same thing for Bitcoin and smaller altcoins?
No. Market liquidity, volatility, available historical data, and trading behavior differ between assets. A provider must demonstrate that its scoring method is reliable for the relevant markets. Performance established on Bitcoin cannot automatically be applied to less liquid cryptocurrencies.
What if there aren’t enough past signals to check a confidence score?
A limited sample prevents strong conclusions about reliability. The score can still be described as a model output, but its predictive performance remains insufficiently established. Additional observations and representative testing are required before making dependable statistical claims.
Can a confidence score change after a trading candle closes?
Yes, if the provider recalculates its rating using updated market information. The system’s update schedule determines when the displayed value changes. A credible historical record should preserve the score available when each signal was issued, rather than replacing it with a later calculation.
For research and education. Not financial advice. Crypto trading involves risk.