A backtest can make an AI trading signal look profitable on paper. The real question is whether that profit would have survived actual market conditions. To backtest AI trading signals, we need historical signals, reliable price data, clear execution rules, and realistic trading costs. We then measure the results and test whether the apparent advantage survives on unseen data. Without those checks, a profitable backtest is just an attractive number.
How to Backtest AI Trading Signals Step by Step
We approach backtesting as a reconstruction of trading decisions. Every entry, exit, and position size must follow rules that could have been applied when the signal appeared.
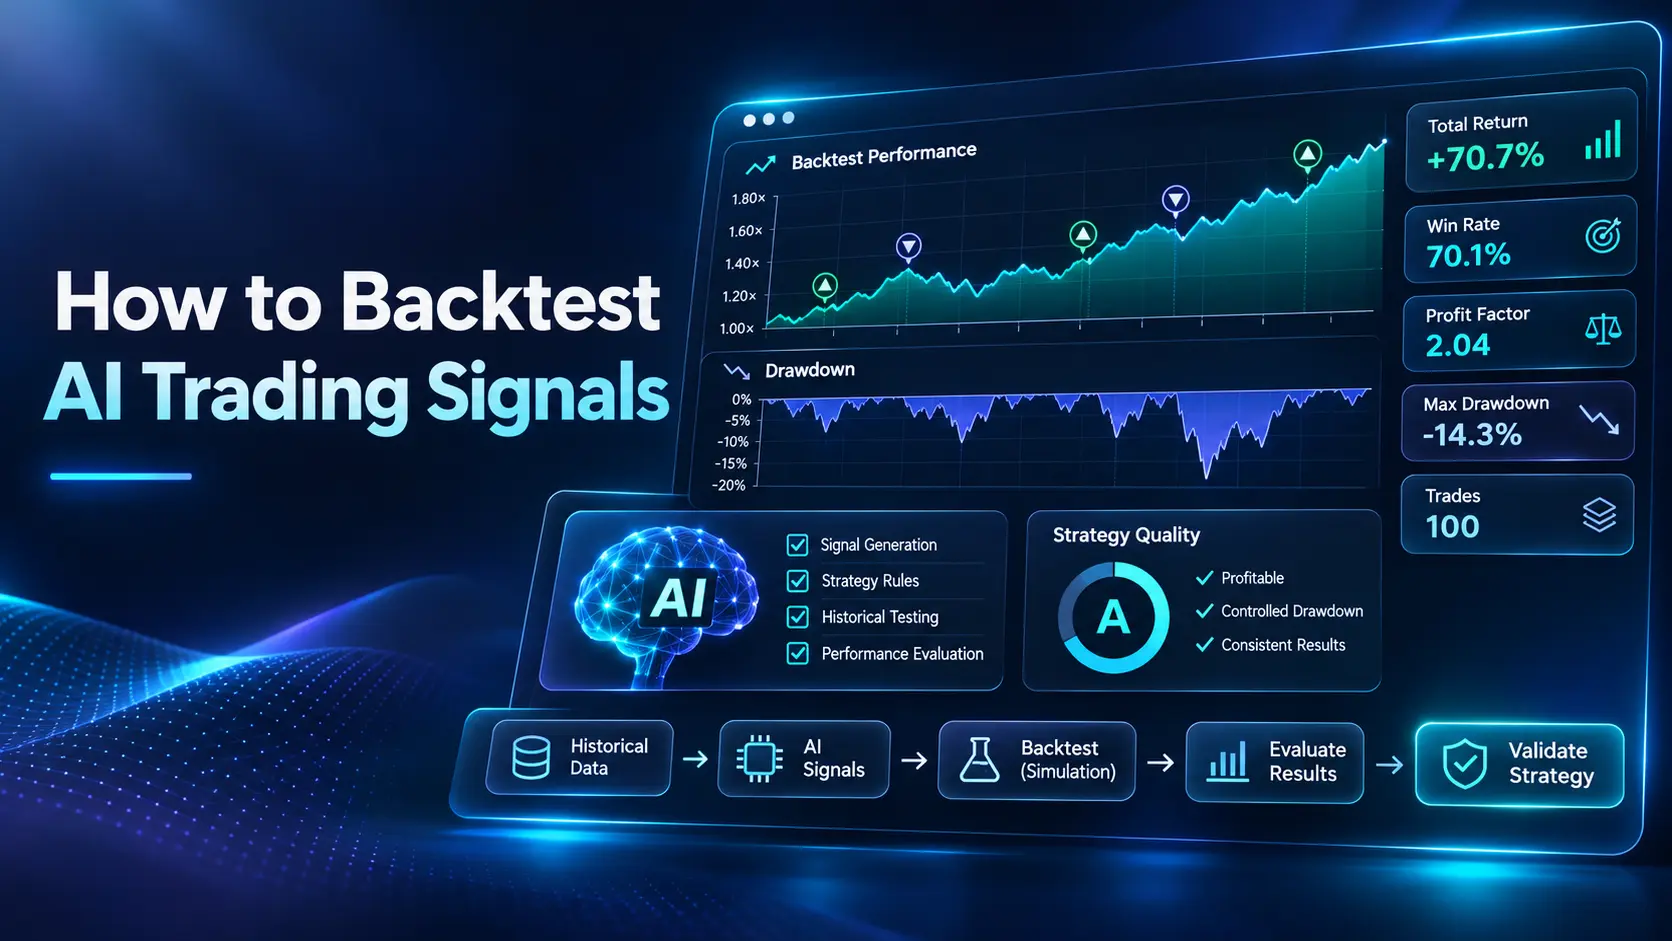
The process has seven stages.
1. Define the Trading Rules
Start with the exact information provided by the signal. A bullish prediction alone cannot produce a reproducible backtest.
We need to know when the signal appeared, what triggered the entry, how much capital the trade would use, and what conditions would close the position.
For example, consider a BTC/USDT signal with the following rules:
- Direction: Long
- Signal timeframe: One hour
- Entry: Buy at the first eligible market price after the signal
- Stop loss: 2% below the executed entry
- Take profit: 4% above the executed entry
- Position size: $1,000
- Maximum holding period: 24 hours
The same rules must apply to every eligible signal in the test.
If the market does not reach the intended entry price, the trade must follow a predefined cancellation rule. We cannot replace the planned entry with a more favorable historical price.
2. Collect Historical Market Data
The next step is collecting price data for the exchange, trading pair, and timeframe being tested.
For crypto trading, historical OHLCV data provides the opening, highest, lowest, and closing prices alongside trading volume.
We also need the original signal records. Each record should include its creation time, direction, trading pair, and any entry or exit conditions.
Data from the exchange where trades would have been executed is preferable to unrelated price feeds because spreads, liquidity, and prices differ between venues.
Before running the test, check for missing candles, duplicate records, inconsistent timestamps, and unexplained price gaps.
A missing candle should not be treated as evidence that no price movement occurred.
3. Reconstruct Historical Signals
This is where backtesting AI trading signals differs from testing a conventional technical strategy.
A recorded signal shows what a system actually produced at a particular time. Reconstructing a signal means determining what the model would have produced using information available at that historical moment.
These are not automatically equivalent.
If the provider saved its original alerts, we can replay those alerts against historical market data.
If we are recreating signals from a model, we must establish which model version, inputs, and parameters were available during the historical period.
Running a model trained today against old Bitcoin candles does not prove that the model would have generated the same predictions in the past.
A present day model could already contain information learned from that period.
For AI Signals, we consider this distinction essential because the source and timing of the prediction determine what the backtest can legitimately demonstrate.
4. Simulate Trade Execution
Once the historical decisions are established, we replay each trade in chronological order.
A market order generated after a candle closes cannot automatically receive that candle’s closing price. The execution model must use a price that would have been available after the order was submitted.
The simulation also needs to define what happens when an entry is missed, an order cannot be filled, or several signals compete for the same capital.
We keep the execution assumptions consistent throughout the test.
5. Include Trading Costs
Gross trading profits are not the same as money retained after execution.
A credible backtest accounts for exchange fees, bid and ask spreads, and slippage. For futures strategies, funding payments and relevant margin costs also need consideration.
Small costs become especially important when a strategy trades frequently or targets relatively small price movements.
We prefer to calculate performance after costs from the beginning rather than present an attractive gross return and adjust it later.
6. Measure Historical Performance
After completing the simulated trades, calculate the results from the full trade record.
The core metrics are net profit, win rate, profit factor, maximum drawdown, and average net profit or loss per trade.
A high win rate is not sufficient evidence of profitability.
A strategy that wins nine trades worth $10 each and loses one trade worth $120 has a 90% win rate but loses $30 before trading costs.
We therefore evaluate the size of profits and losses alongside their frequency.
7. Validate the Results
The final stage is testing whether the observed performance extends beyond the historical data used to develop the model or choose its settings.
Reserve a later period that was not used for training or tuning. Evaluate the unchanged strategy on that period.
We also examine performance under less favorable execution assumptions and across different market environments.
A strategy that depends on one narrowly selected period or one exact parameter deserves further investigation before being considered reliable.
Historical Signals vs Reconstructed AI Predictions
There are two practical ways to test historical AI trading signals, and the distinction changes the meaning of the results.
Backtesting Recorded Signals
When original alerts have been archived, we can match each signal to the market data that followed it.
This approach tests the performance of the recorded signal stream under a specified trading strategy.
The archive should preserve the original timestamps and include all eligible alerts, not only successful examples.
A provider that publishes screenshots of winning trades without retaining unsuccessful alerts does not provide a complete dataset for performance evaluation.
Backtesting an AI Model
When the model itself generates predictions during the replay, each historical decision must use the appropriate model version and only information available at that point.
For models that require periodic training, the simulation must reproduce the training schedule.
Predictions should then be generated in chronological order without allowing future observations to influence earlier decisions.
This approach can evaluate model behavior, but it requires more information and technical control than replaying archived alerts.
Both methods are useful. They simply answer different questions.
AI Trading Signal Backtesting Example
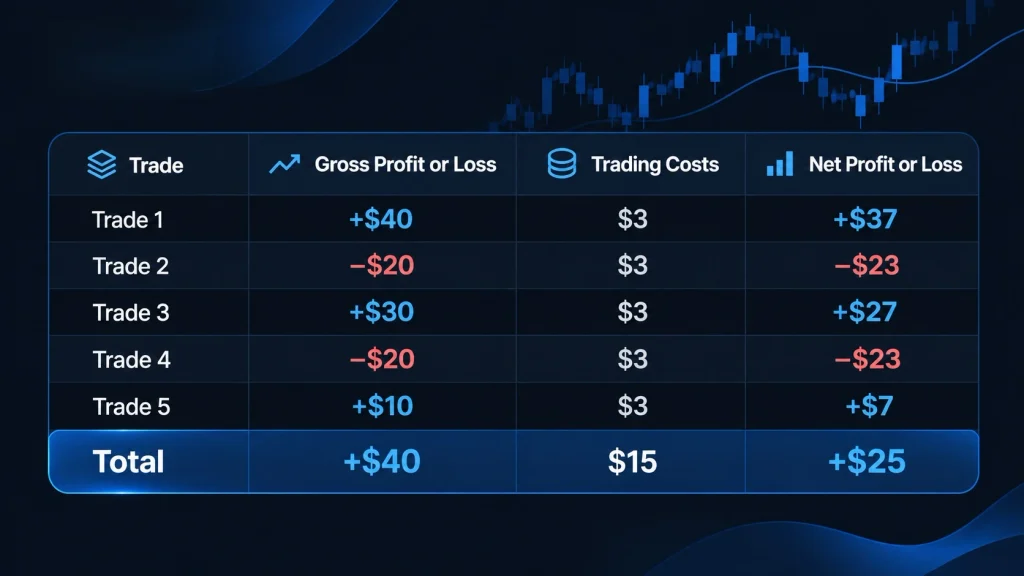
Consider a hypothetical BTC/USDT signal strategy tested using five completed trades.
Each trade uses $1,000 of notional exposure. For this simplified illustration, we assume a fixed total execution cost of $3 per completed trade, representing combined transaction fees and slippage.
The gross profits and losses below are invented examples, not results from a live model or an actual historical experiment.
Calculating Win Rate
Three trades produced net profits, while two produced losses.
Win Rate = 3 ÷ 5 × 100 = 60%
This tells us how frequently the simulated trades were profitable, not how much money the strategy earned.
Calculating Net Profit
The five trades generated $40 in gross profit.
After deducting $15 in modeled trading costs, the remaining net profit is $25.
A strategy with more frequent transactions would face greater accumulated costs under the same assumptions.
Calculating Profit Factor
Profit factor compares the total net profits from winning trades with the absolute total net losses from losing trades.
Net profits from winning trades:
$37 + $27 + $7 = $71
Absolute net losses from losing trades:
$23 + $23 = $46
Profit Factor = 71 ÷ 46 = 1.54
A profit factor above 1 indicates that recorded gross gains from winning trades exceed the losses from losing trades under the tested assumptions. Here, the calculation uses individual trade results after costs.
The example is profitable, but five trades are far too few to establish a dependable trading advantage.
Its purpose is to demonstrate the calculations, not to validate a strategy.
Backtest Performance Metrics
A complete AI trading signal backtesting report needs to show more than the final account balance.
The following metrics answer different questions about profitability and risk.
| Metric | What It Shows | What to Examine |
|---|---|---|
| Win Rate | Percentage of profitable closed trades | Profit and loss size alongside winning frequency |
| Net Return | Change in account equity after costs | Return relative to starting capital |
| Profit Factor | Net gains from winners divided by absolute net losses from losers | Whether gains exceed losses |
| Maximum Drawdown | Largest decline from a previous equity peak | Depth of capital losses |
| Expectancy | Average net profit or loss per trade | Whether the average outcome is positive |
| Trade Count | Number of completed trades | Amount of evidence behind the results |
| Market Exposure | Capital committed and time spent in positions | Risk taken to produce the reported return |
We place particular importance on maximum drawdown because the final account balance does not reveal the financial pressure experienced along the way.
A strategy could finish with a positive return after suffering a severe decline that would have been unacceptable to the trader using it.
Drawdown should be calculated from the account equity path, including the value of open positions, rather than relying only on closed trade balances.
Performance Across Market Conditions
One overall return can hide important differences between periods.
A model trained during a strong Bitcoin rally can show attractive historical results because the underlying market was rising.
To understand the source of performance, examine results across rising, falling, and sideways markets where suitable observations exist.
We also compare the signal strategy with a simple benchmark under comparable capital exposure and trading costs.
If a more complicated AI model does not provide a measurable improvement over a transparent trading rule, its additional complexity needs justification.
Look Ahead Bias and Overfitting
An impressive backtest can result from the way an experiment was constructed rather than from a genuine predictive advantage.
Two problems require particular attention.
Look Ahead Bias
Look ahead bias occurs when a historical decision uses information that would not have been available at the time.
For example, imagine a model that generates buying signals at 10:00 AM using the final closing price of the candle ending at 11:00 AM.
The simulation has allowed the model to access future information.
The resulting performance cannot represent an executable strategy.
For each input, the backtest must respect when the information became available, not merely the date associated with the data.
This applies to price candles, indicator calculations, market announcements, and revised datasets.
Model Overfitting
Overfitting occurs when a model captures patterns specific to its development data that do not generalize well to new observations.
The same issue appears when traders repeatedly adjust signal thresholds until historical performance looks attractive.
Suppose a confidence threshold of 82 produces exceptional results in the selected historical period.
That observation is not enough to establish that 82 is a dependable threshold.
We would examine nearby values and test the chosen threshold on data that was not used during optimization.
If the result deteriorates sharply with modest changes, the historical advantage is less convincing.
Out of Sample and Walk Forward Testing
Backtesting crypto trading signals becomes more informative when development and evaluation are kept separate.
Out of Sample Testing
Divide the historical dataset chronologically.
Use an earlier period for developing the model and choosing its parameters. Reserve a later period for evaluation.
The later period should remain untouched until the model and trading rules have been fixed.
This provides a clearer test of whether the strategy performs beyond the data used to build it.
Walk Forward Validation
Walk forward testing extends the process across multiple historical periods.
A model is trained or adjusted using earlier observations, then evaluated on the next period.
The evaluation window advances, and the process repeats using only the information available at each stage.
This approach is particularly relevant to models designed to adapt as new market data becomes available.
It does not guarantee future profitability, but it provides a more defensible assessment than selecting the strongest result from a single historical window.
Testing Cost Sensitivity
Execution assumptions should also be tested.
We examine what happens when fees increase, entry prices become less favorable, or orders experience additional delay.
If a strategy’s profitability disappears after a small, realistic increase in trading costs, the reported advantage is fragile.
The backtest should make that limitation visible.
Tools for Backtesting AI Trading Signals
The best setup depends on whether the trader has archived signals or access to the model’s underlying rules.
Spreadsheet Backtesting
A spreadsheet is a practical starting point when the signal archive is small and the execution rules are straightforward.
Create columns for signal time, asset, direction, proposed entry, actual simulated entry, exit price, position size, costs, and net result.
Match each archived signal to historical prices and calculate the trade outcome according to the predefined rules.
This gives a transparent record that can be inspected manually.
However, spreadsheets become less suitable when the model generates a large number of signals, positions overlap, or execution depends on detailed intraday price movements.
TradingView Strategy Testing
TradingView supports historical strategy testing through Pine Script.
A strategy script can define entry and exit conditions and generate simulated trades with a performance report.
This is useful when the signal logic can be expressed as explicit rules.
However, a strategy that reproduces the general idea of an AI signal is not automatically a historical replay of the original AI model.
We would label the result accordingly.
Python and Freqtrade
Python offers greater flexibility for handling archived predictions, historical data, custom execution rules, and performance analysis.
Freqtrade provides backtesting functionality for coded cryptocurrency trading strategies, including historical candle data and configurable fees.
Both approaches require enough technical control to ensure that the correct signals, timestamps, and execution assumptions are used.
The tool matters less than the quality of the experiment it runs.
Interpreting Backtest Results
A profitable historical result is evidence worth examining, not proof that a signal service will produce future profits.
Before drawing a conclusion, we want to establish three things.
First, the historical decisions must be reproducible using information that was available at the time.
Second, the reported performance must include realistic execution costs and account risk.
Third, the results must survive evaluation on unseen data without repeatedly adjusting the rules to fit that same data.
If these conditions are not satisfied, the backtest cannot establish a reliable performance claim.
The next step for a promising strategy is a forward paper trading period using the unchanged model and risk rules. This helps reveal differences between historical assumptions and actual signal delivery, order timing, and execution.
Final Thoughts
Backtesting AI trading signals is not about finding the most impressive historical return. It is about understanding whether a trading method produced consistent, executable results under conditions that reflect the information available at the time.
At Pineva, we consider the signal record, execution assumptions, and evaluation method just as important as the final profit.
A useful backtest makes its limitations visible. It shows which rules were followed, what the trades cost, where losses occurred, and how the strategy performed beyond the data used to develop it.
Historical results cannot guarantee future performance. They can, however, provide a disciplined basis for deciding whether a trading idea deserves further testing.
FAQ
Can we backtest AI signals that were posted in a Telegram channel?
Yes, provided the original messages retain reliable timestamps and enough information to reconstruct the trading rules. Edited posts, missing alerts, and incomplete entry instructions reduce the validity of the results. The archive must also include unsuccessful signals rather than only published winners.
What if the stop loss and take profit both get hit in the same candle?
OHLC data alone cannot establish which price was reached first within that candle. The backtest needs more detailed price data or a documented conservative execution assumption. Assuming the profitable exit occurred first creates an unjustified advantage.
Do canceled signals count as losing trades in a backtest?
No. A canceled signal is not a completed losing trade unless the predefined strategy actually entered and closed a position at a loss. Cancellations should be recorded separately so their frequency and impact on trading opportunities remain visible.
Does changing the AI model mean we have to start the backtest again?
A material model change creates a new strategy version that requires its own evaluation. Historical results from an earlier version remain valid as records of that version, but they cannot establish the performance of the updated model. Results should be reported with the corresponding model versions.
How many AI signals do we need before a backtest means anything?
There is no universal minimum that guarantees statistical reliability. The required sample depends on variation in trade outcomes, dependence between signals, trading frequency, and the range of market conditions represented. A larger and more diverse sample supports stronger conclusions than a small set of highly correlated trades.
For research and education. Not financial advice. Crypto trading involves risk.